- Place
- Los Angeles, California
- Timeline
- 2021 – 2025
- Clients
- SphericalAccelerate Resilience L.A. (ARLA)
- Role
- Product Lead at Spherical, overseeing strategy, design, and data science
- Services
- Product
- Design
- Data
- Strategy
- Ops
01
Overview
Building on the pioneering work of Andy Lipkis in urban watersheds, ARLA partnered with Spherical to develop a platform for resilience in Los Angeles County. The goal: cultivate a pipeline of infrastructure projects that benefit L.A.'s watersheds, communities, and ecoystems.
Spherical helped ARLA develop a Living Infrastructure framework: regenerating natural and built systems through community care. ARLA's support allowed the platform to be free for the public—and enabled community groups to participate.
Over four years, I helped define the vision, hire the team, design the platform, and write educational content. The result was an accessible map-based planning tool, compendium of local data sets, and guidebook of resources.
From a map to a funded project
Find places that need attention, design remedies with neighbors, and turn the result into a proposal.
- remedies for cooling, food access, habitat, and flood safety
- 40+
- local data layers, curated into thematic visualizations
- 65+
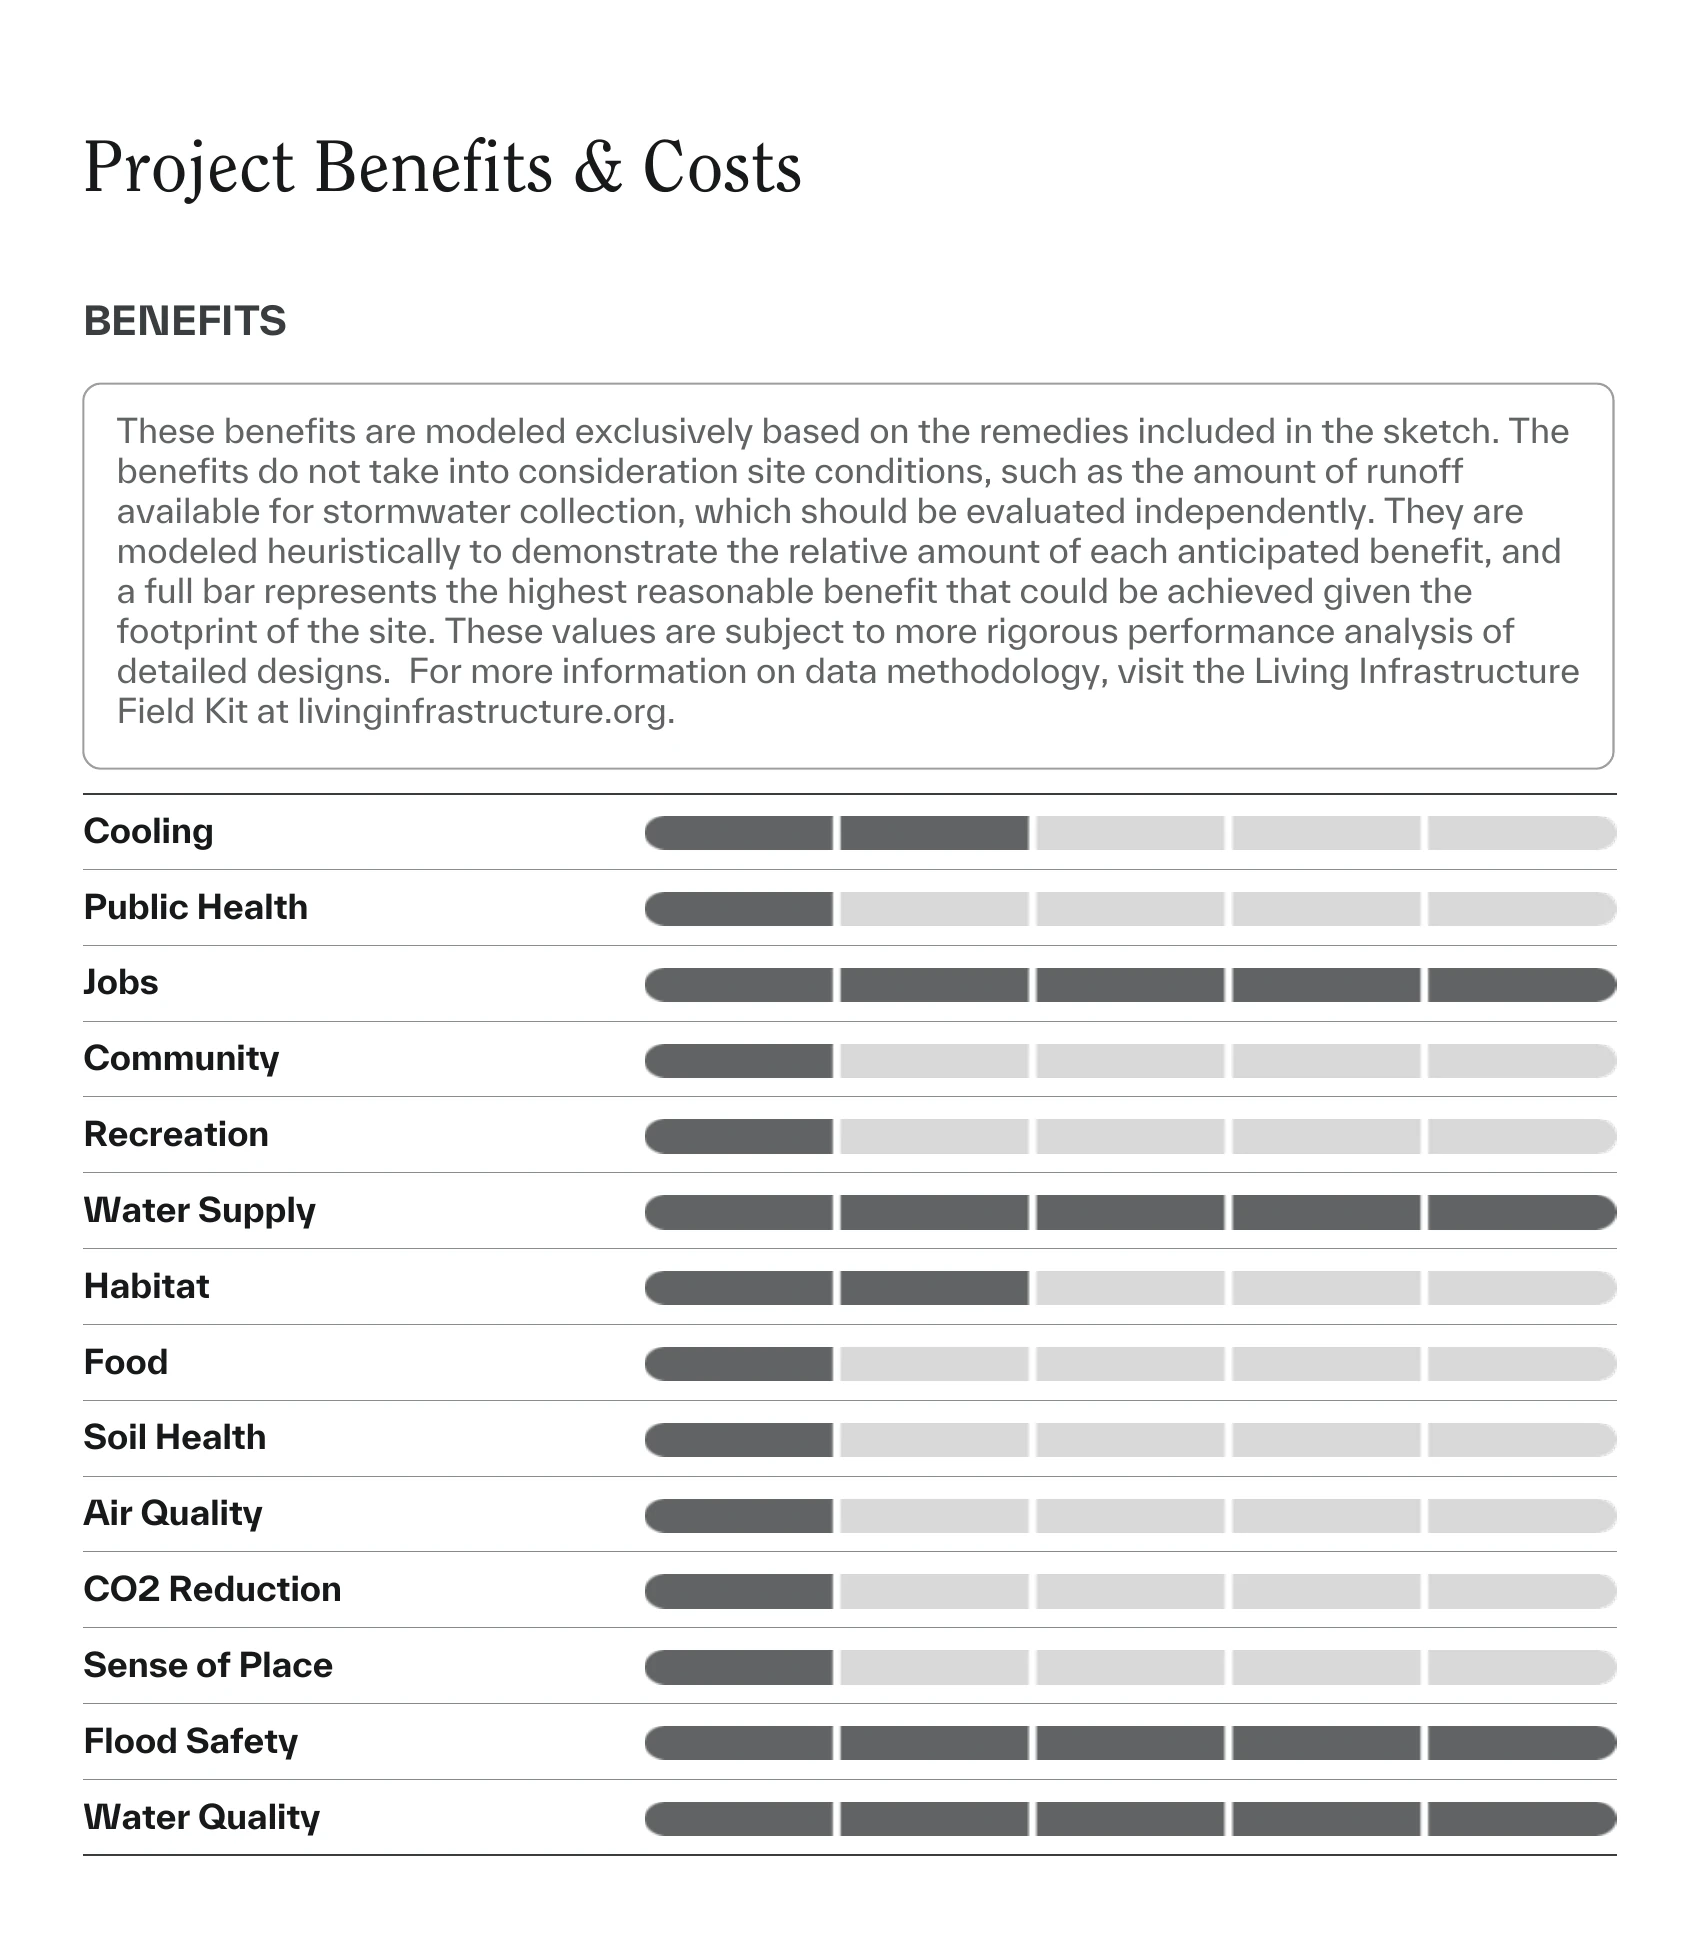
- benefits modeled for each project, along with costs
- 13+
- for the public
- Free
02
Learn about places
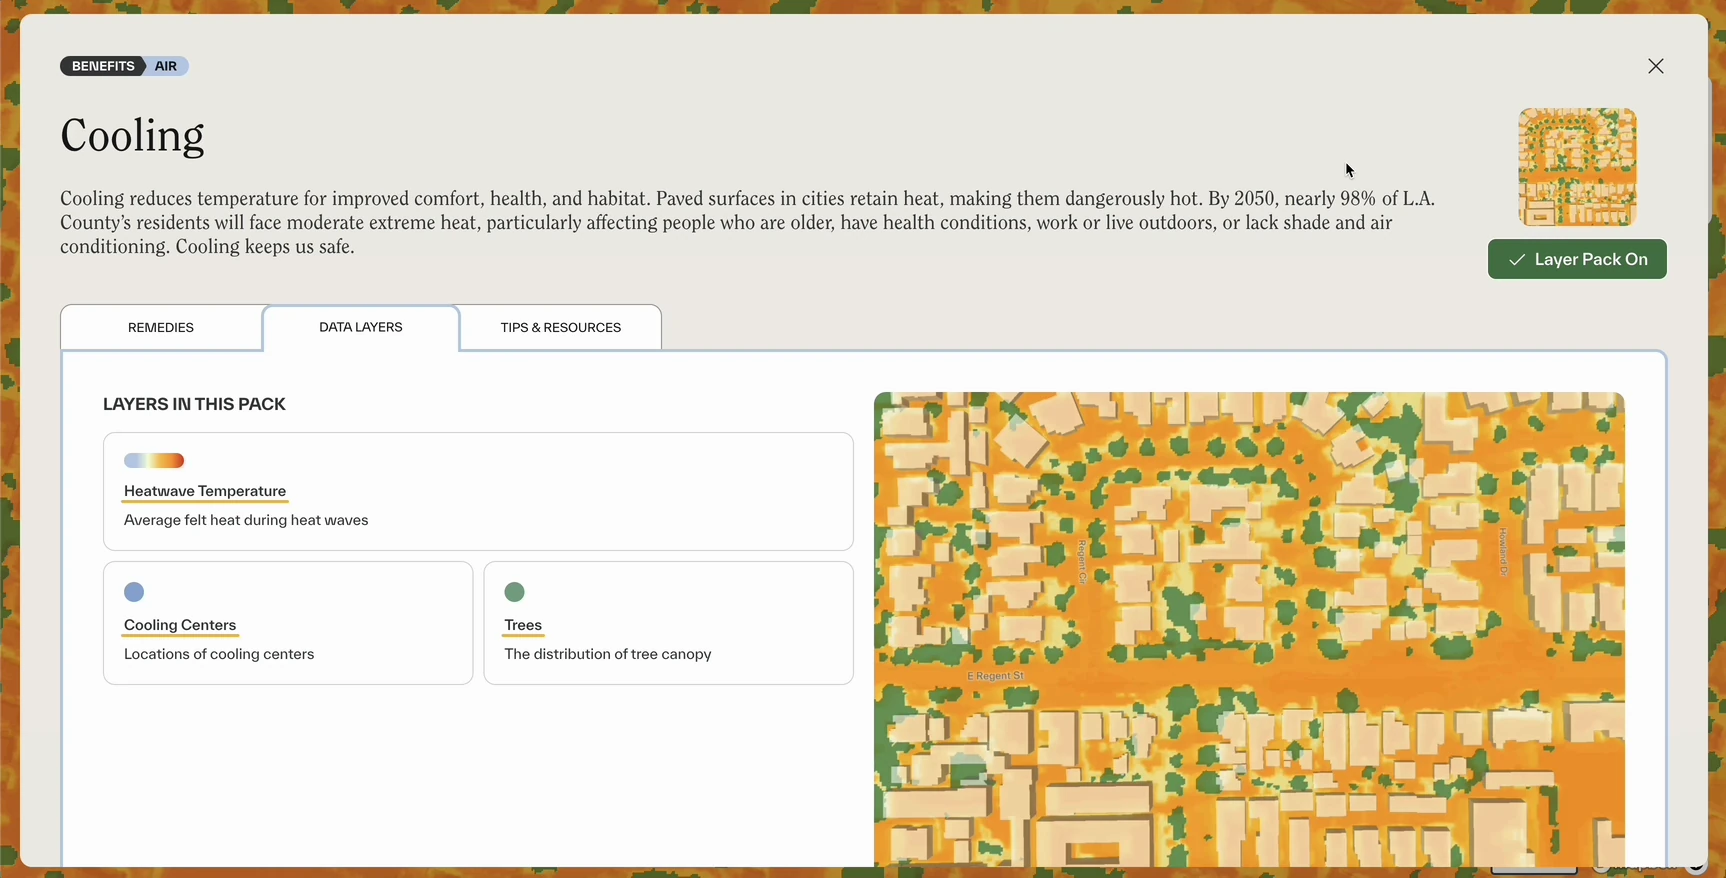
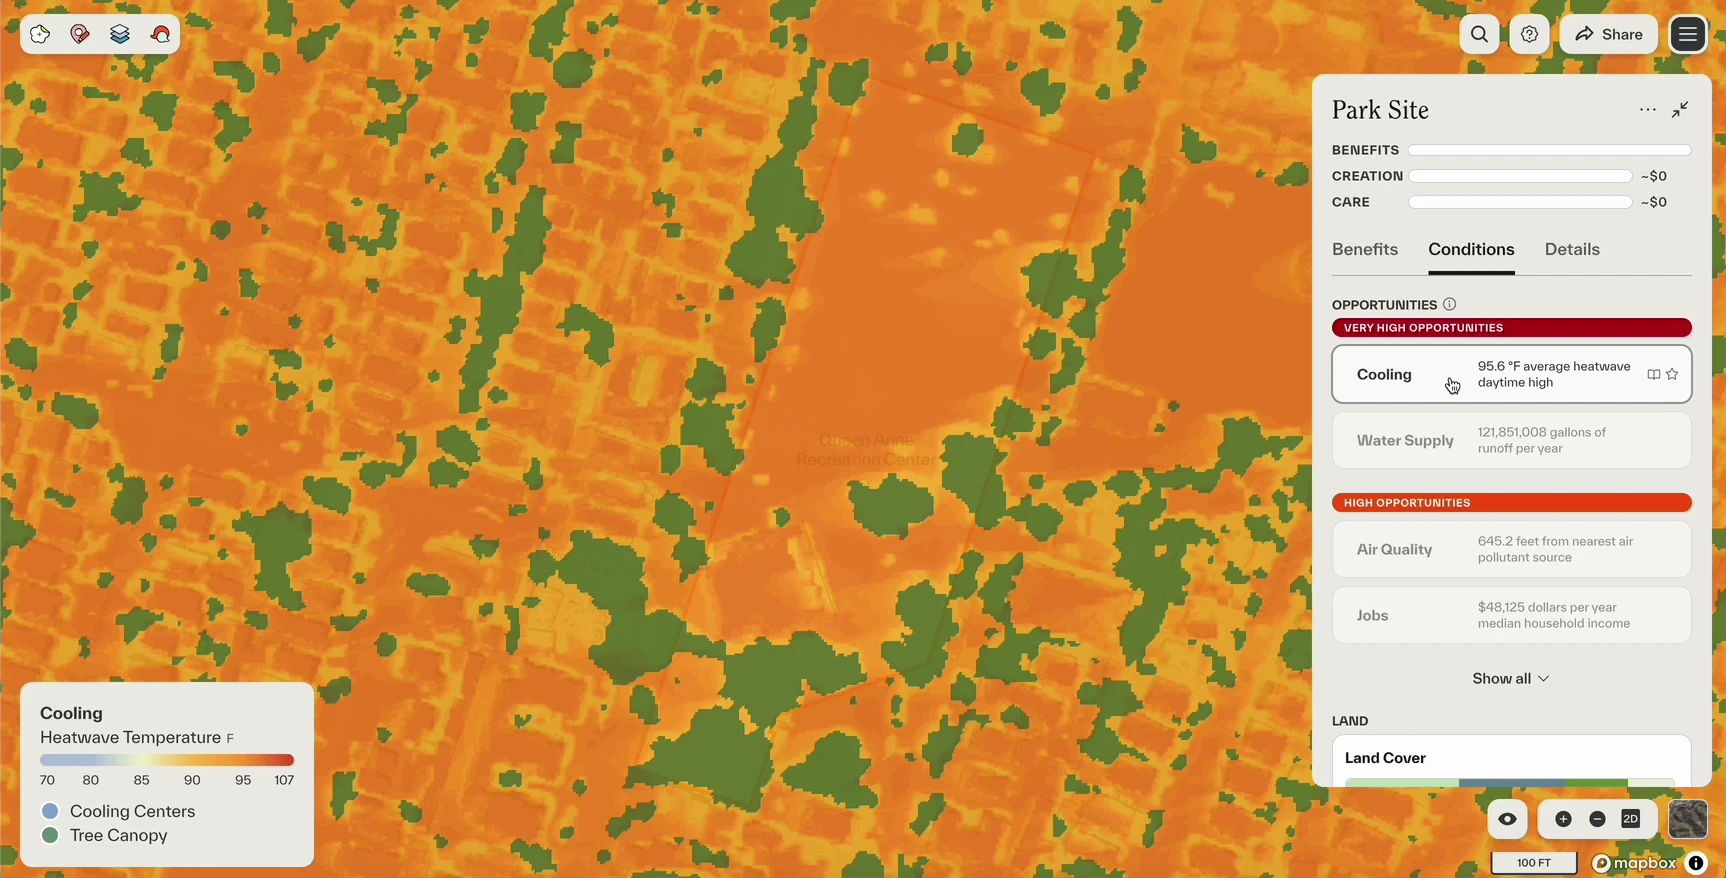
The first step of planning a project is identifying a site and understanding what it needs. Unlike the data layers of traditional GIS tools, we curated visualizations around project goals like Cooling and Recreation. For each theme, we designed a site prioritization metric and visualization. For Cooling, we created a first-of-its-kind hyperlocal 1-meter heat data layer with the University of Pennsylvania, and visualized it alongside tree canopy and cooling centers.
Through community workshops and public boards, project creators collect qualitative needs and opportunities on the site—like where people gather or see issues. With quantitative and qualitative data together, creators can prioritize sites and understand exactly what needs their site needs—down to where exactly on the site interventions should be made.
03
Design with remedies
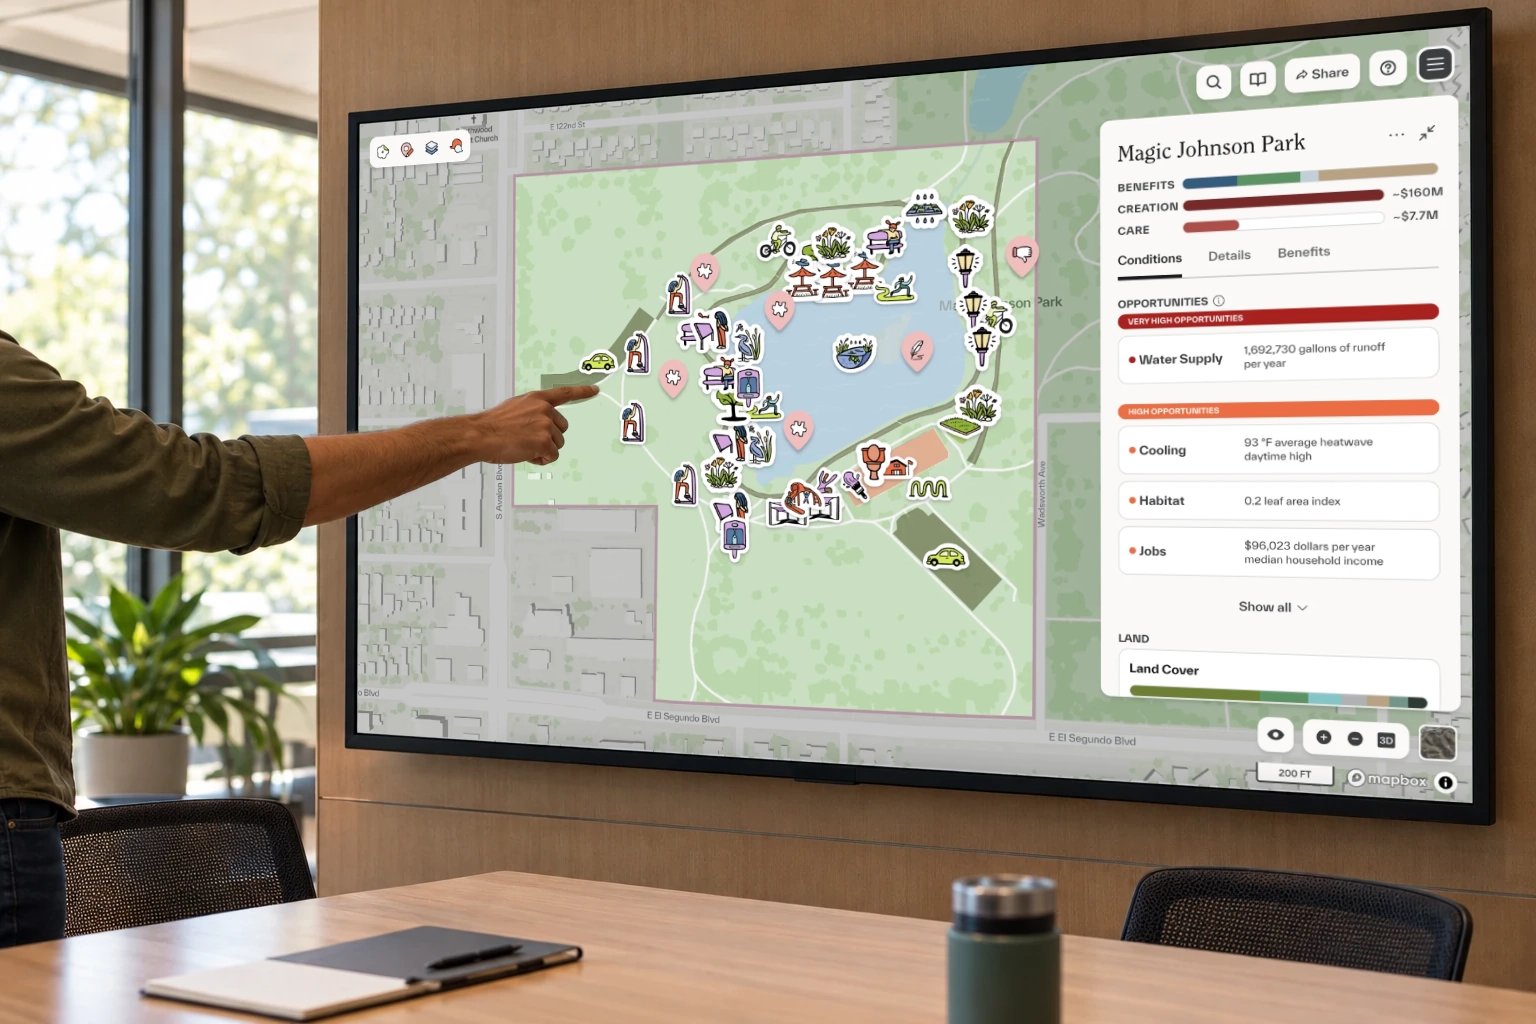
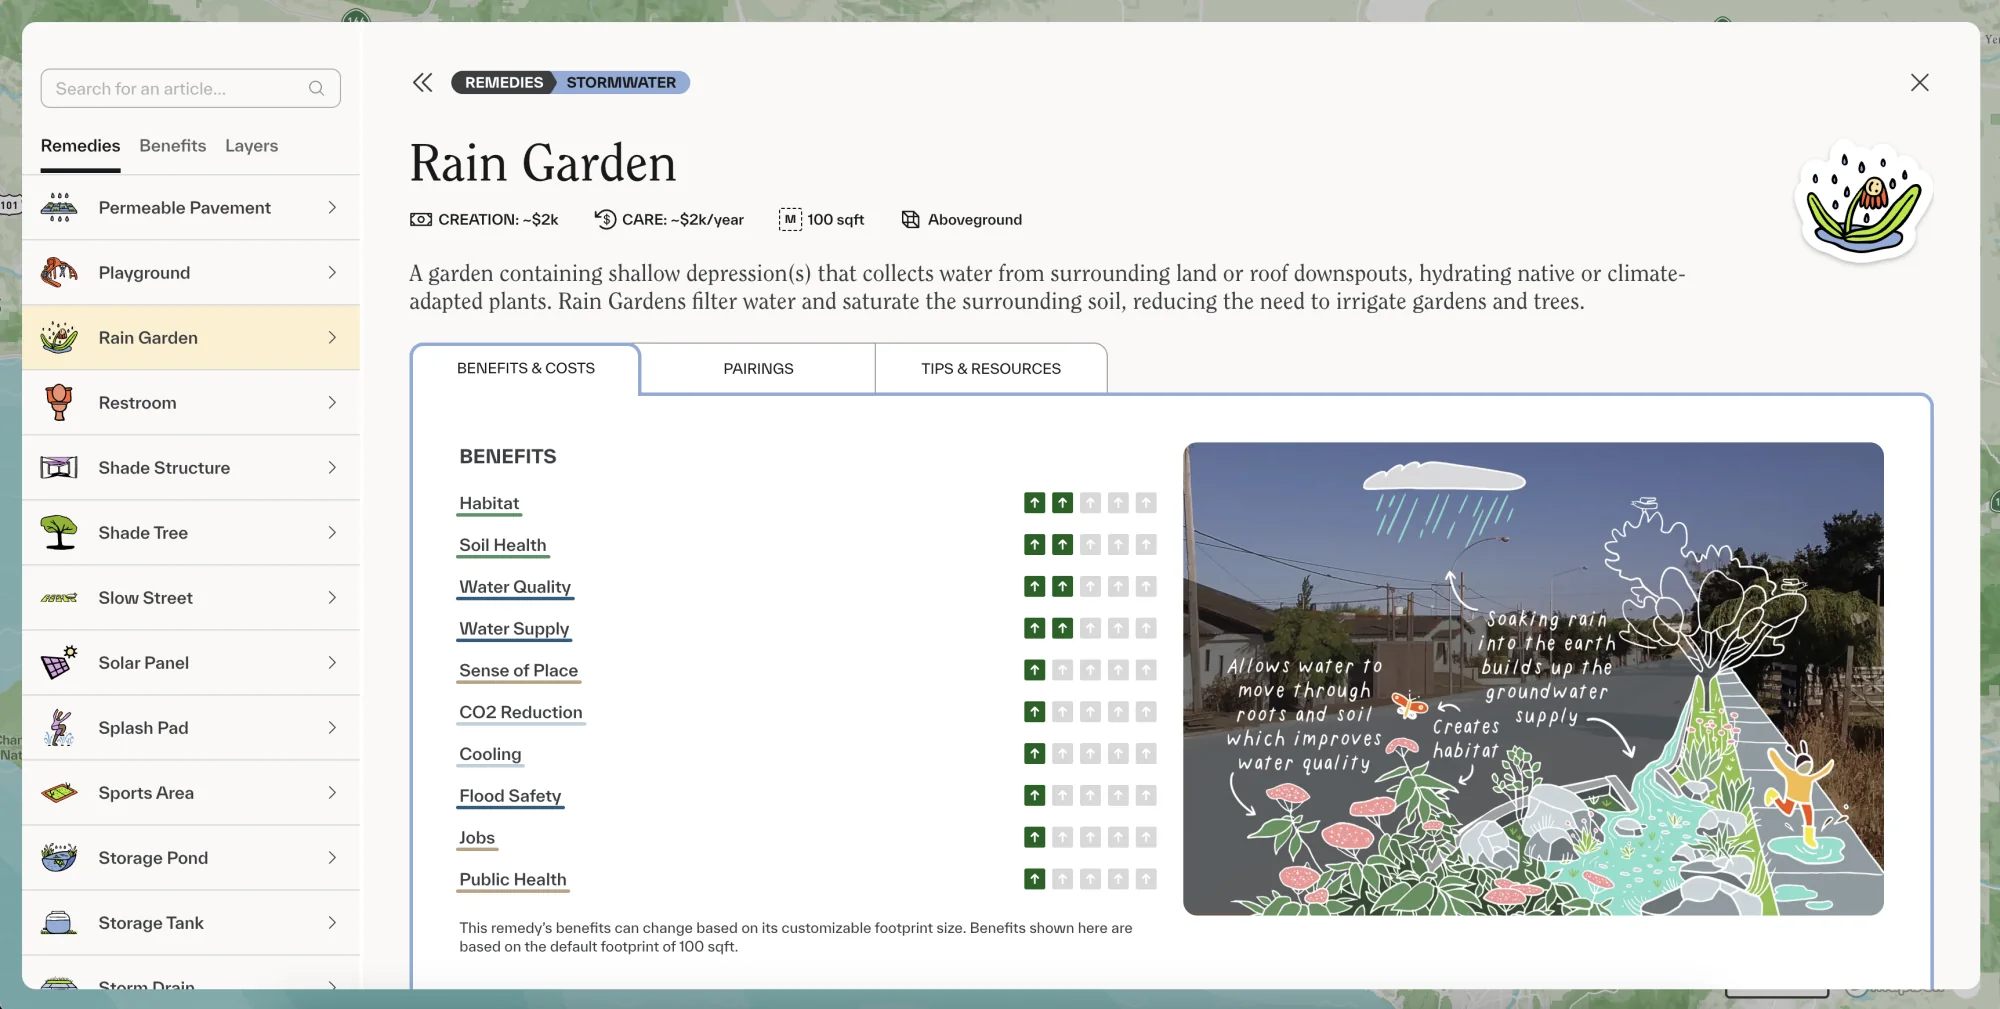
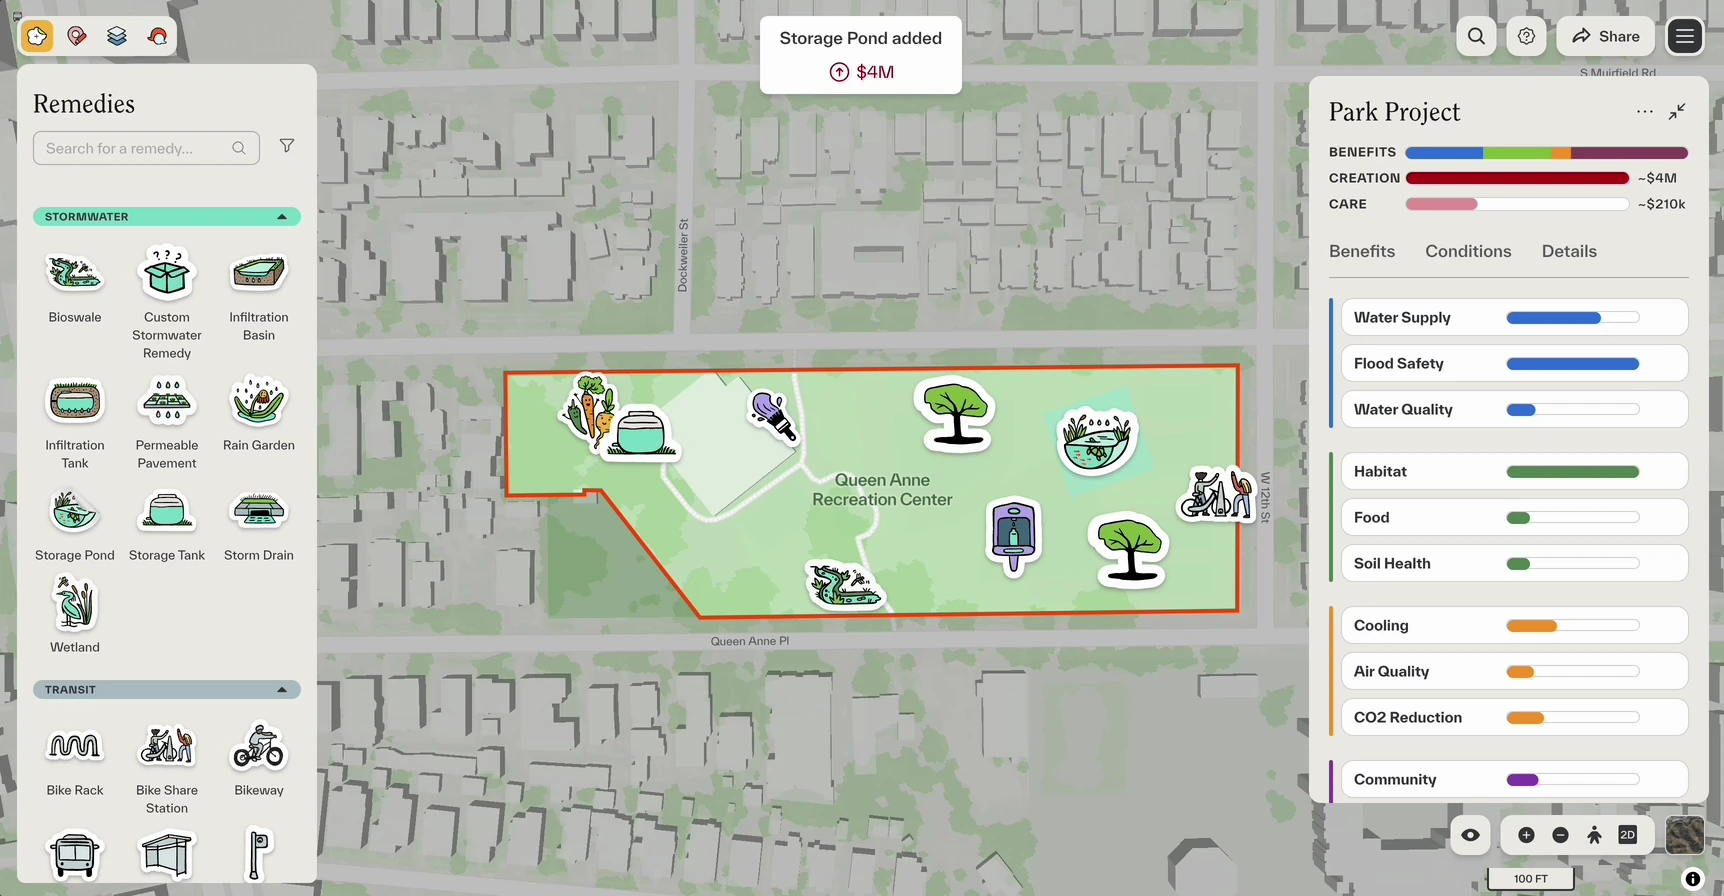
We wanted designing projects to feel generative—more like using a whiteboard and less like CAD. Users can drag stickers representing needs and remedies onto the map. A library of remedies, from rain gardens to shade trees, shows what each one costs to create and care for and what it gives back: habitat, cooling, water quality, and jobs. Teams place them on a site together and watch the benefits and costs add up.
04
Submit funding proposals
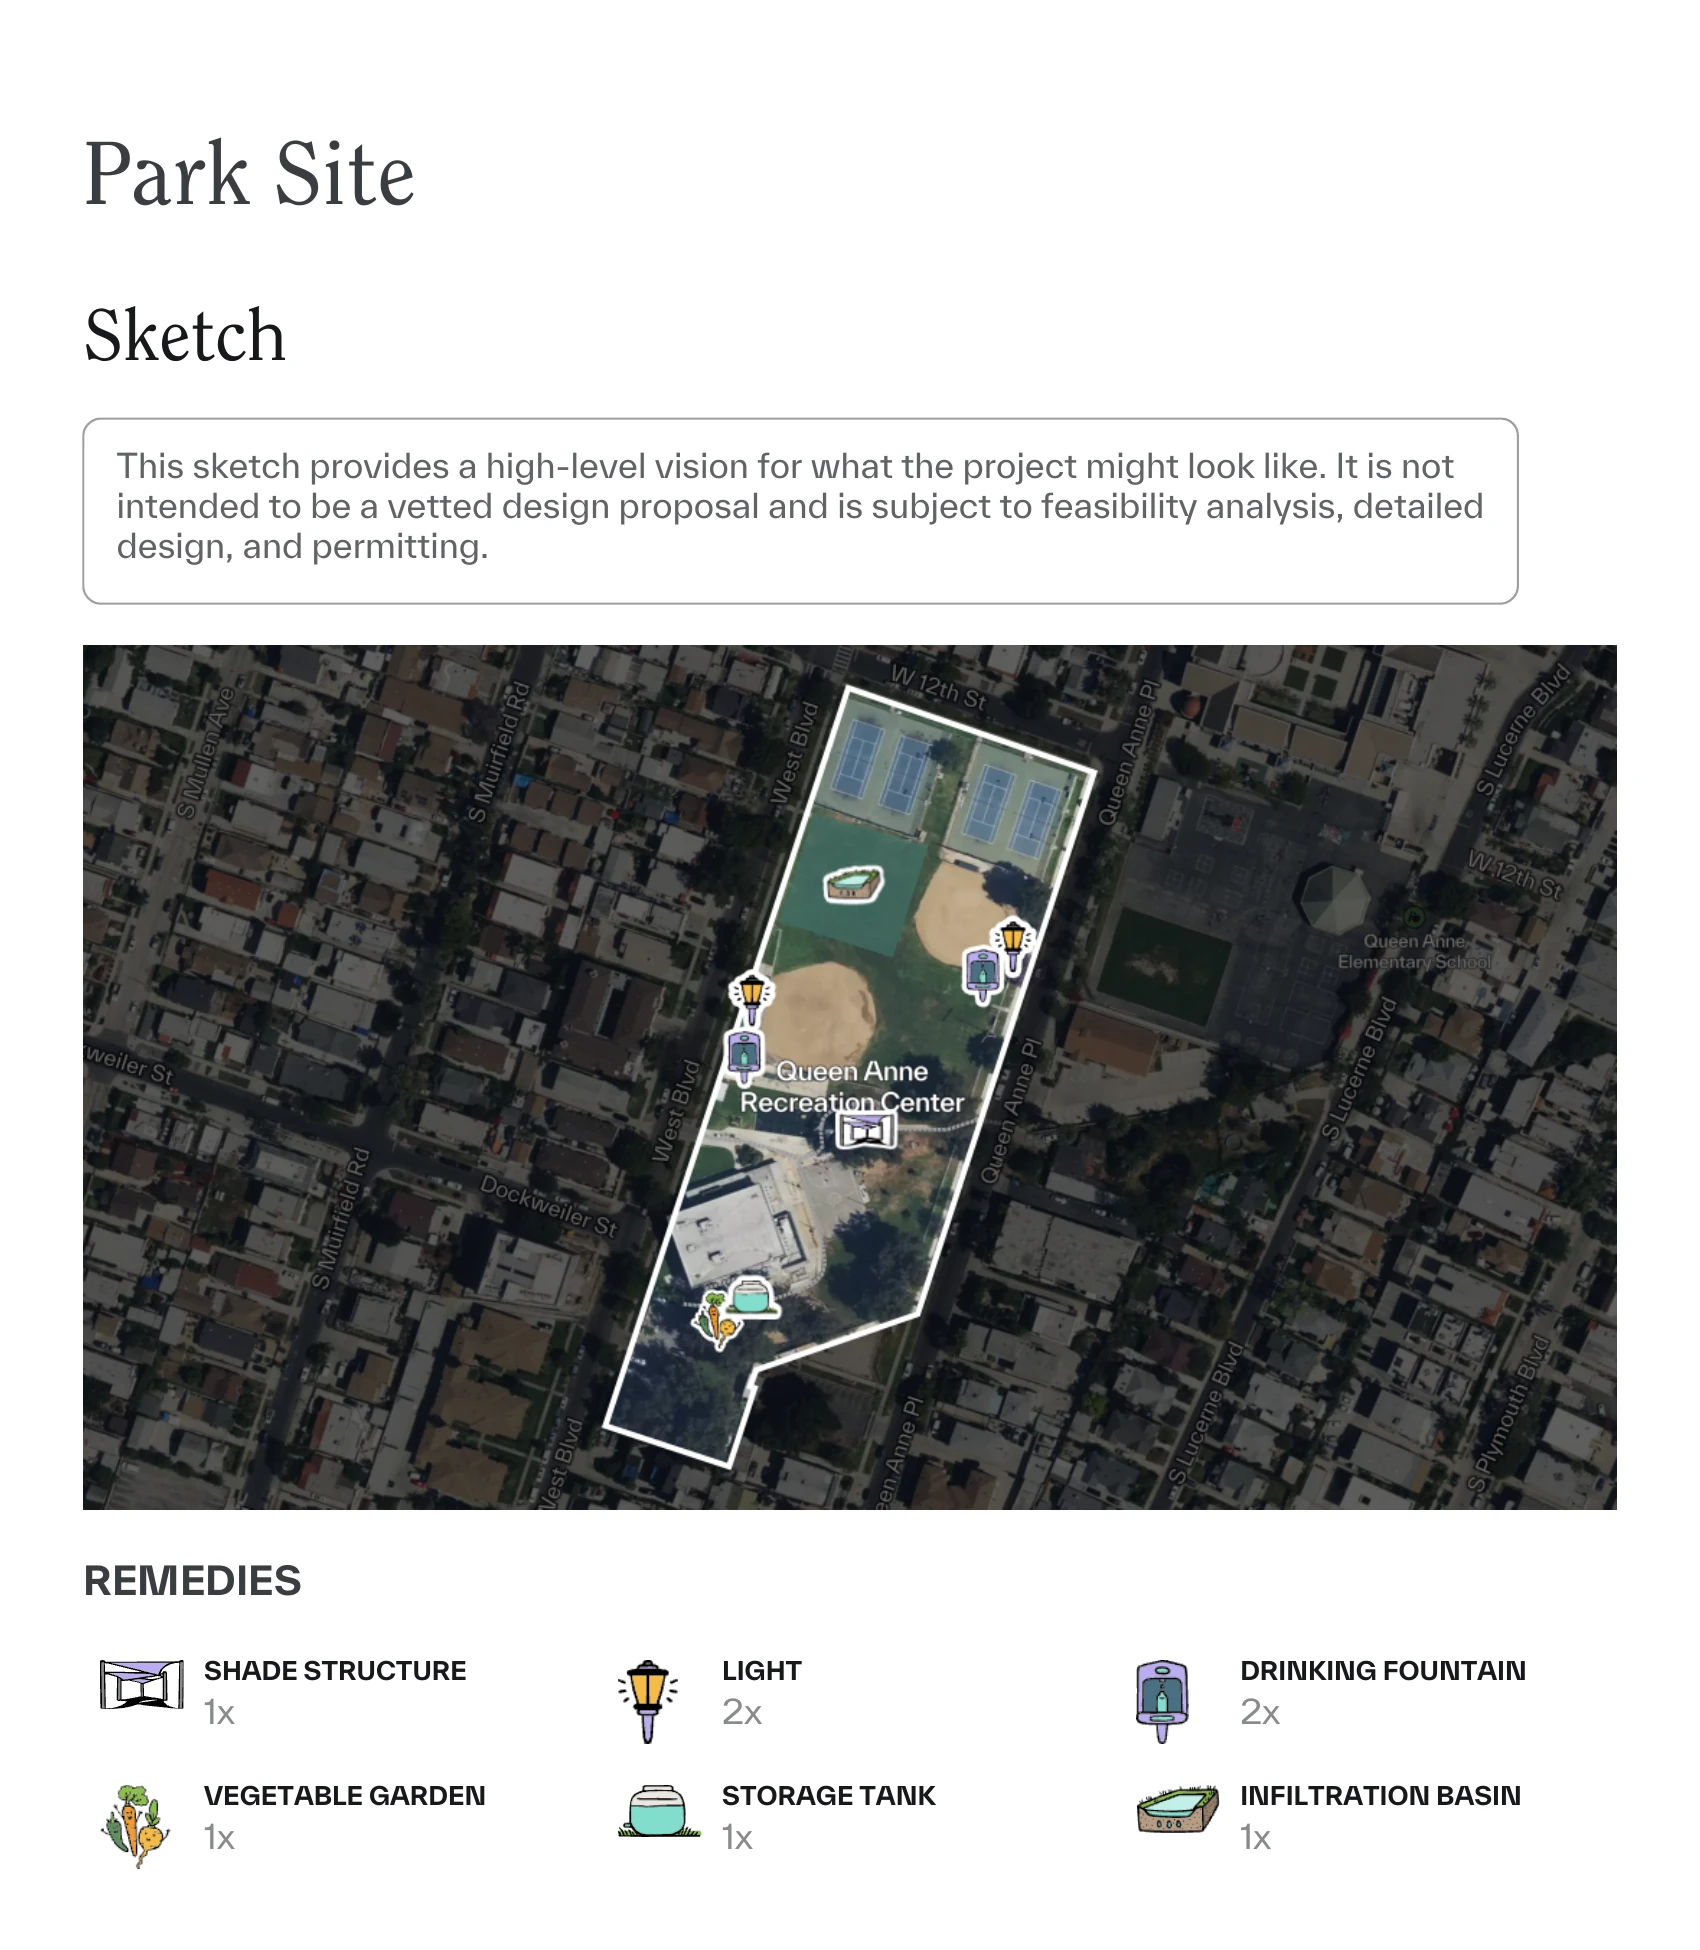
Through our partnerships with L.A. County government agencies, we designed a project report for creators toattach to funding applications. At a quick glance, stakeholders can understand the project, along with its projected benefits and costs for both creation and long-term care.
Government agencies and community groups continue to co-create projects and needs assessments through the platform.